element14 Community
element14 Community
    Register Log In
  • Site
  • Search
  • Log In Register
  • About Us
  • Community Hub
    Community Hub
    • What's New on element14
    • Feedback and Support
    • Benefits of Membership
    • Personal Blogs
    • Members Area
    • Achievement Levels
  • Learn
    Learn
    • Ask an Expert
    • eBooks
    • element14 presents
    • Learning Center
    • Tech Spotlight
    • STEM Academy
    • Webinars, Training and Events
    • Learning Groups
  • Technologies
    Technologies
    • 3D Printing
    • FPGA
    • Industrial Automation
    • Internet of Things
    • Power & Energy
    • Sensors
    • Technology Groups
  • Challenges & Projects
    Challenges & Projects
    • Design Challenges
    • element14 presents Projects
    • Project14
    • Arduino Projects
    • Raspberry Pi Projects
    • Project Groups
  • Products
    Products
    • Arduino
    • Avnet Boards Community
    • Dev Tools
    • Manufacturers
    • Multicomp Pro
    • Product Groups
    • Raspberry Pi
    • RoadTests & Reviews
  • Store
    Store
    • Visit Your Store
    • Choose another store...
      • Europe
      •  Austria (German)
      •  Belgium (Dutch, French)
      •  Bulgaria (Bulgarian)
      •  Czech Republic (Czech)
      •  Denmark (Danish)
      •  Estonia (Estonian)
      •  Finland (Finnish)
      •  France (French)
      •  Germany (German)
      •  Hungary (Hungarian)
      •  Ireland
      •  Israel
      •  Italy (Italian)
      •  Latvia (Latvian)
      •  
      •  Lithuania (Lithuanian)
      •  Netherlands (Dutch)
      •  Norway (Norwegian)
      •  Poland (Polish)
      •  Portugal (Portuguese)
      •  Romania (Romanian)
      •  Russia (Russian)
      •  Slovakia (Slovak)
      •  Slovenia (Slovenian)
      •  Spain (Spanish)
      •  Sweden (Swedish)
      •  Switzerland(German, French)
      •  Turkey (Turkish)
      •  United Kingdom
      • Asia Pacific
      •  Australia
      •  China
      •  Hong Kong
      •  India
      •  Korea (Korean)
      •  Malaysia
      •  New Zealand
      •  Philippines
      •  Singapore
      •  Taiwan
      •  Thailand (Thai)
      • Americas
      •  Brazil (Portuguese)
      •  Canada
      •  Mexico (Spanish)
      •  United States
      Can't find the country/region you're looking for? Visit our export site or find a local distributor.
  • Translate
  • Profile
  • Settings
Industrial Automation
  • Technologies
  • More
Industrial Automation
Blog Connect to AVNET iotconnect.io with Node-RED - part 5: online dashboard
  • Blog
  • Forum
  • Documents
  • Quiz
  • Events
  • Polls
  • Files
  • Members
  • Mentions
  • Sub-Groups
  • Tags
  • More
  • Cancel
  • New
Join Industrial Automation to participate - click to join for free!
  • Share
  • More
  • Cancel
Group Actions
  • Group RSS
  • More
  • Cancel
Engagement
  • Author Author: Jan Cumps
  • Date Created: 12 Mar 2021 5:40 PM Date Created
  • Views 1324 views
  • Likes 5 likes
  • Comments 2 comments
  • raspberry
  • avnet
  • smartedge
  • node_red
  • cloud
  • iotconnect.io
Related
Recommended

Connect to AVNET iotconnect.io with Node-RED - part 5: online dashboard

Jan Cumps
Jan Cumps
12 Mar 2021

AVNET's iotconnect.io cloud platform is an online service that you can use to send data to, and then show it on a dashboard*. In this blog series I'm learning how to talk to it with Node-RED.

In this post: the dashboard (live link).

image


In the previous part of the series, I've done all the steps to exchange data between a thing and the iotconnect.io cloud.

And how to do that with Node-RED.


In this post, I will step away from Node-RED for a moment, and focus on working with the data online.

I'll create a dashboard to show the telemetry data (temperature) from my device, and build an email alert.

All of that is done in the IotConnect portal.


Make a Dashboard


In the portal (I do not put a link here, because you need to consult previous posts to get to this point), click on the New Dashboard link

image


Create a new one, and edit it:

image


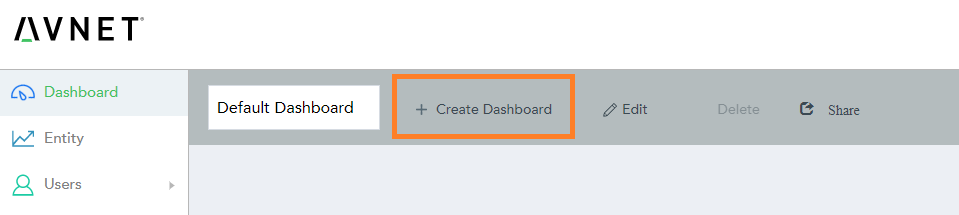
Give it a name and save.

image

Click Edit Property, and make it the default board

image


Show the most recent Temperature


Let's start with a simple tile to show the temperature.

Drag a single tile on the canvas. Click the ... to enter the properties form.

Set name, select device and attribute. It will list all available devices, and the attributes of the associated template.

image


Apply and save the dashboard. It is a Live control and will not yet show data. The control shows data that arrives after the board is displayed.

It's now time to go to your Node-RED flow and send a message to the cloud.

image

You'll see that the tile shows the info almost immediately after you pushed it to the cloud.


Show a Temperature Chart


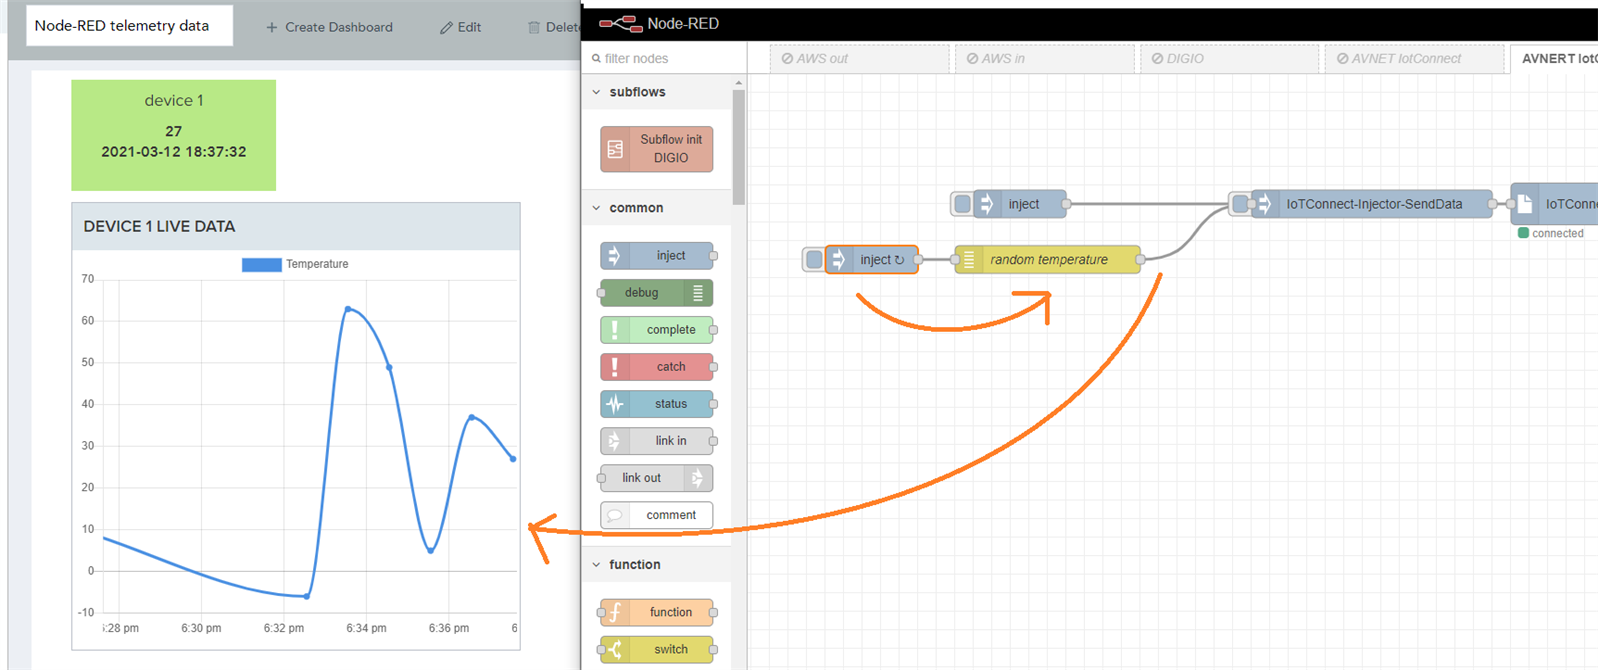
Now let's try a chart. To get somewhat interesting data, I modified the Node-RED flow to "generate" random temperature data, every 5 minutes.

image

image

Here's the payload definition of the injector:


[
 {
  "uniqueId":"e14nodered1",
  "data":
  {
   "Temperature":"0"
  }
 }
]


Then the generator overrides the temperature:

image


This will give a steady data stream. A new temperature every 5 minutes. Deploy the flow.

Now add a line chart to the dashboard. Edit it, set the title, select the device and attribute.

image

Apply and save.

Because the Node-RED flow generates a temperature "measurement" every 5 minutes, you'll slowly see the chart showing the data.

If you are impatient, you can increase the repeat speed of the inject node of your flow. But be careful not to overrun the quota of your iotconnect.io account.

It may be better to just manually push the inject button a few times. It will generate enough data points then to show on the chart.


Here's my board after a few exchanges:

image


and a more elaborate one:

image


There are controls for asset tracking:

image

The left upper chart shows devices physical locations (the device has to communicate LAT and LON).

The chart below that shows the itinerary of a single device. You can use this for rolling material or assets you rent out or lease.

The two tables on the right show new devices added to your portfolio, and alarms.


The Python SDK with On Semiconductor RSL10 BLE article seriesIndustry
part 1: overview and goal
part 2: WiFi Provisioning
part 3: Adding a Module (RSL10)
part 4: Talk BLE to the On Semi RSL10 Sensor Kit
part 5: A Cloud User Experience Example
part 6: Register as a Gateway Device
part 7: Register a Gateway and Client Devices
The NODE-Red SDK article seriesIndustry
part 1: overview and goal
register a Thing and connect to IoTConnect.io cloud
part 2: create an account and log on to the portal
part 3: set up the thing and its interface in the cloud
part 4: set up Node-RED and first exchange
interact with IoTConnect.io cloud
part 5: online dashboard
part 6: rules and alerts
part 7: messages and commands from the cloud
safer connections with certificates
part 8a: safer connect with Self Signed Certificates
part 8b: safer connect with CA certificatesY
commercial and industrial scale: outsource certificate generation and programming to subcontractors and suppliers
part 9a: Outsource Certificate Signing in IIoT Supply ChainY
part 9b: IIoT supply chain and Certificates - Create Ca Root certificate, Load to IoTConnect Cloud and ValidateY
part 9c: IIoT supply chain and Certificates - Create an Intermediate CA Certificate for your SubcontractorY
part 9d: IIoT supply chain and Certificates - Subcontractor Generates a Thing Certificate for Your DeviceY
part 9e: IIoT supply chain and Certificates - Test!Y
commercial and industrial scale: Trusted Platform Module (TPM) Authentication
part 10: Trusted Platform Module (TPM) SecurityY
Infineon SLx9670 Trusted Platform Module (TPM) for IoT SecurityY
The Automate Device Provisioning and Cloud Configuration article seriesIndustry
Automatic Provisioning with REST APIY
  • Sign in to reply

Top Comments

  • Jan Cumps
    Jan Cumps over 4 years ago +1
    This is what a full flow could look like. The input and output parts are test blocks. Input feeds generated values, output goes to a debug window. But the whole middle section is a full blown communication…
  • Jan Cumps
    Jan Cumps over 4 years ago +1
    Different dashboard artwork, focused on assets:
  • Jan Cumps
    Jan Cumps over 4 years ago

    Different dashboard artwork, focused on assets:

    image

    • Cancel
    • Vote Up +1 Vote Down
    • Sign in to reply
    • More
    • Cancel
  • Jan Cumps
    Jan Cumps over 4 years ago

    This is what a full flow could look like.

    image

    The input and output parts are test blocks.

    Input feeds generated values, output goes to a debug window.

    But the whole middle section is a full blown communication block that can send and receive data, and deal with confirmation messages.

    • Cancel
    • Vote Up +1 Vote Down
    • Sign in to reply
    • More
    • Cancel
element14 Community

element14 is the first online community specifically for engineers. Connect with your peers and get expert answers to your questions.

  • Members
  • Learn
  • Technologies
  • Challenges & Projects
  • Products
  • Store
  • About Us
  • Feedback & Support
  • FAQs
  • Terms of Use
  • Privacy Policy
  • Legal and Copyright Notices
  • Sitemap
  • Cookies

An Avnet Company © 2025 Premier Farnell Limited. All Rights Reserved.

Premier Farnell Ltd, registered in England and Wales (no 00876412), registered office: Farnell House, Forge Lane, Leeds LS12 2NE.

ICP 备案号 10220084.

Follow element14

  • X
  • Facebook
  • linkedin
  • YouTube