RoadTest: Sound and Vibration Measurement Hat for Raspberry Pi - Industrial Sensing
Author: Jan Cumps
Creation date:
Evaluation Type: Evaluation Boards
Did you receive all parts the manufacturer stated would be included in the package?: True
What other parts do you consider comparable to this product?: At this range, I couldn't find comparable solutions. There are a number of other solutions, with industrial housing and higher specs. They start at a price 2 orders of magnitude higher than this solution, but offer out-of-box integration with industrial (MathLab, Scada, LabVIEW) applications
What were the biggest problems encountered?: Skilling up. DAQs and vibration analysis are niche skills.
Detailed Review:
My objective for the road test is to evaluate the kit in a real world situation. I’m building a vibration test jig to analyse the behaviour of little devices when they are shaken. And I’m developing software for the Raspberry Pi host, a dedicated LabVIEW driver and example flows to use with this test set.
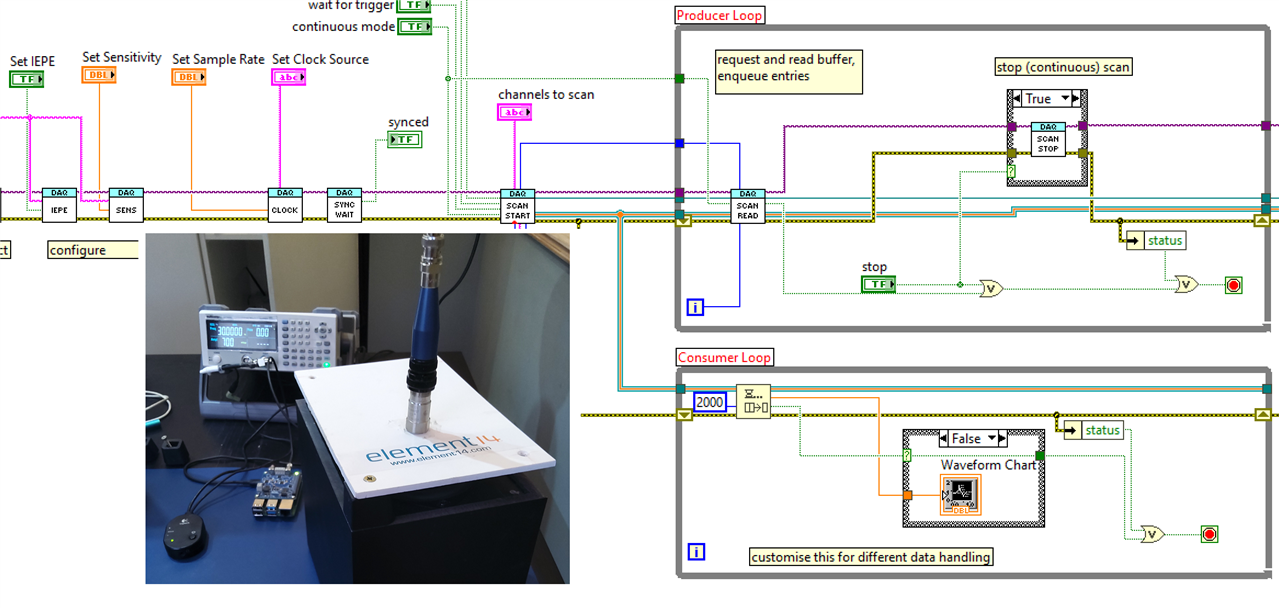
The end result is a test instrument that can be controlled via LabVIEW over the network, and that can stream high volume data over that network. It can play along in a complex flow with several lab instruments (in this case a function generator). Data can be shown real time on screen, processed, stored into a spreadsheet – or a combination.
The road test report is a summary of activities that are documented in 20 blog posts. They are listed and linked at the end of this report.

The road test kit had these components:
MCC172 vibration / sound data acquisition HAT
PCR 603C1 Piezo acceleration sensor
cables and adapters
Raspberry Pi 4
This is a complete set that allows you to build a vibration monitor. You only need to add a power supply. What’s common with all the parts of the kit is that they are of high quality. The DAQ HAT has state of the art analog and analog-to digital components. The Piezo sensor is suited for hazardous environments. The adapters are industry strength.

The MCC172 IEPE DAQ is a data acquisition HAT for the Raspberry Pi family. A 2-channel ADC design made to retrieve data fast and precise. It’s part of a DAQ product family, aiming at measuring vibrations and sound.
It accepts signals up to 5 VPP AC, with a virtually flat (52 millidecibel) bandwidth of 20 Hz to 23 kHz. The low end -3dB cutoff is at 0,78 Hz. High side cutoff is depending on sample frequency: maximum 51.2 kS/s x 0.453.

The software and Pi are able to run both channels at maximum sample rate. There’s a dedicated microcontroller on the HAT that deals with sampling and on-board sample buffering. The Pi only has to deal with configuring before sampling, and then downloading buffered data over a fast SPI bus. It can easily cope with two channels active (also a Pi 3 would be fast enough for that). Multiple boards – up to 8 boards, 16 channels – can be stacked. The max throughput can be sustained with up to 6 channels in use at the same time.
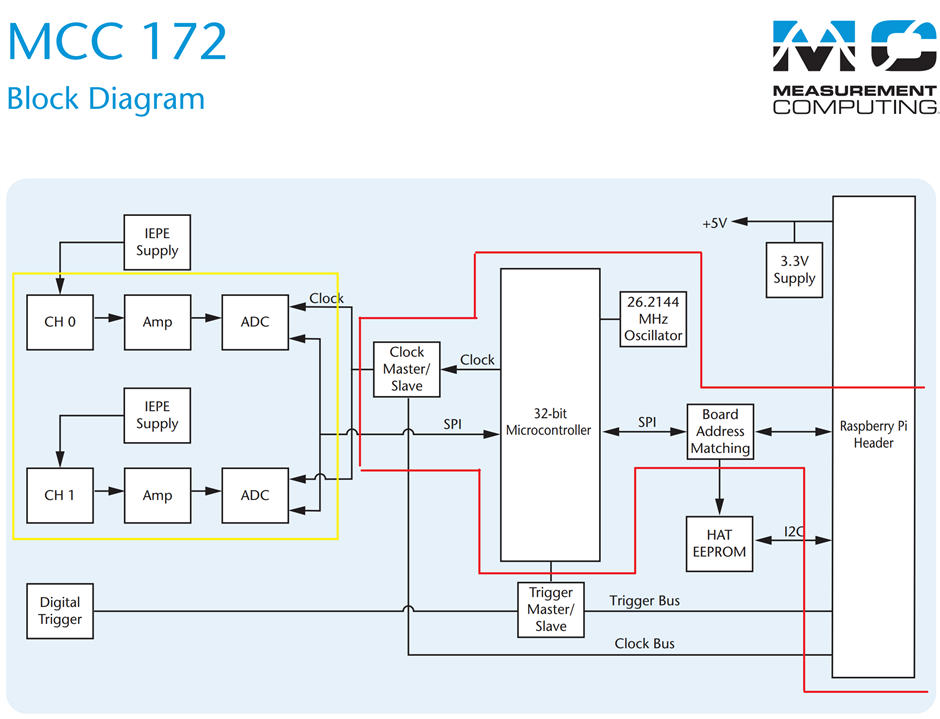
image source: MCC 172 IEPE Measurement DAQ HAT for Raspberry Pi®
The analog side is a 3-stage setup: the input signal is first buffered, then converted to a balanced signal and sent to the ADC.

The channels are 50 Ω, connection via SMA coax or screw terminals. Each channel can inject utility power for IEPE type sensors. They are suitable for measurement microphones and piezo sensors with or without external power requirement.

The PCR acceleration sensor just by itself would be sufficient material for a separate road test. It’s a IEPE type piezo device that’s made for hazardous jobs. Its natural habitat is pumps, gearboxes, engines, factories, inside wind mills.
 |
 |
It’s heavy, 55 g. And sensitive. I’m using it for low acceleration indoor experiments. I received the right photo from martinvalencia. He uses this type of sensors on pumps, motors and gearboxes in the mining industry in Peru.
The sensor needs an external power supply. The DAQ HAT’s IEPE supply is compatible. Here’s an extract of the product specification:

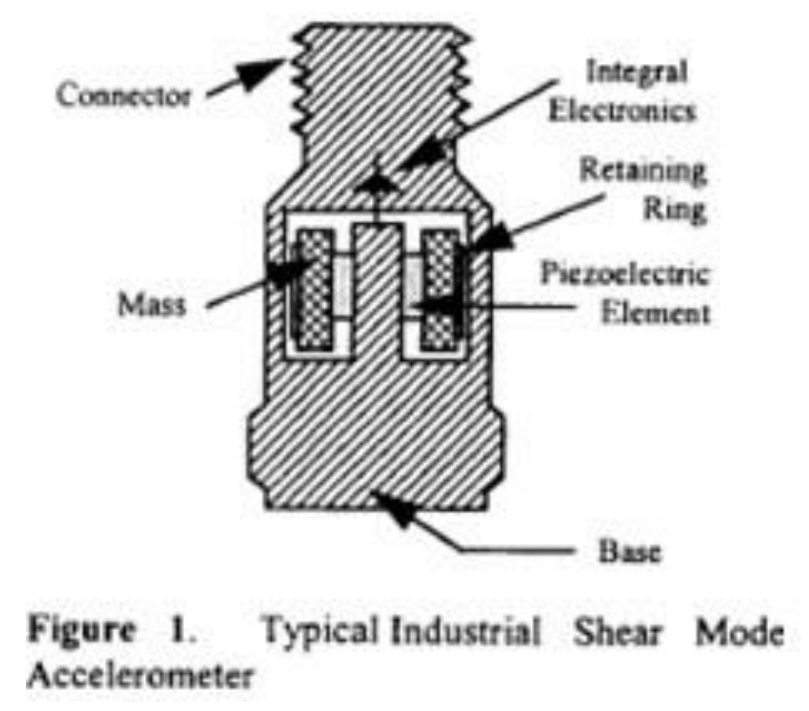
When using it in my road test, the sensor was detecting vibration before I could feel it. They measure acceleration via a mechanism embedded inside the sensor. A mass is attached to the piezo element. Vertical acceleration generates electricity in that element. That’s conditioned and amplified inside the sensor, then sent along to the DAQ.
MCC has published all software for its MCC DAQ family on GitHub. The core is a library with an API to configure the document and retrieve data. The API for the MCC172 is about 20 functions, split up in parameter setters/getters and sampling functions. There are functions that are channel specific, like setting the IEPE output and sensitivity. Clock related functions are across channels.

The sample API is very simple. 3 calls to control execution. Two you’ll always use: to start and to clean up. A 3rd one will stop an active sampling process. The API creates a separate thread while sampling is active. This will collect data from the HAT and buffer it.
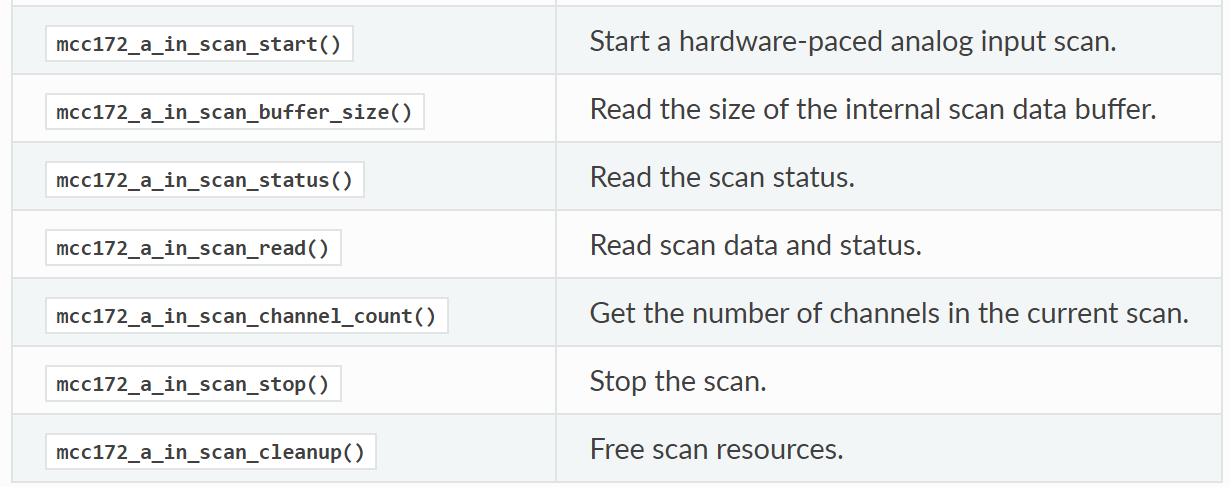
Then there’s a function to read data from those buffers while the scan is active. Because the scan is filling the buffers in its own thread, you can use the main thread in your code to fetch the data and process it. In the custom software I wrote for this device, I’m using an additional thread that reads those buffers and streams them over a network socket. I’ve reviewed the C library and used it in C and C++ programs. The granularity of the API is good – I adapted it for the custom LabVIEW driver design. Each function is well documented. There’s also a Python library. I didn’t review it, but used it when running the MCC examples.
There’s a rich set of Python and C programs that exercise the board. From the Python set, I used the web server regularly. It’s a program that turns the Pi into a web server that shows the samples real time on a graph.

It’s an easy enty point for the first exercices. Immedite feedback of what’s happening with the sensor. I’ve reviewed the C examples more closely, because I wanted to make a custom C/C++ daemon for the instrument, as part of its LabVIEW integration. There are examples focusing on acquisition & speed, on analysys & transformation. And on a combination of those.
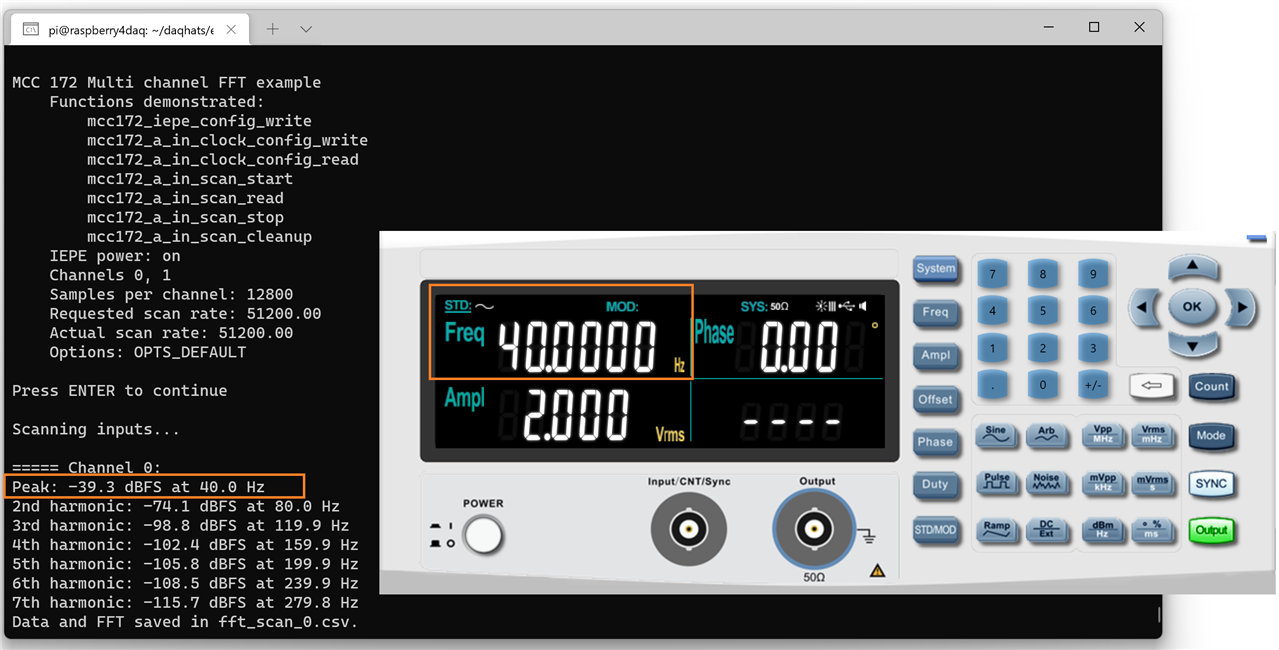
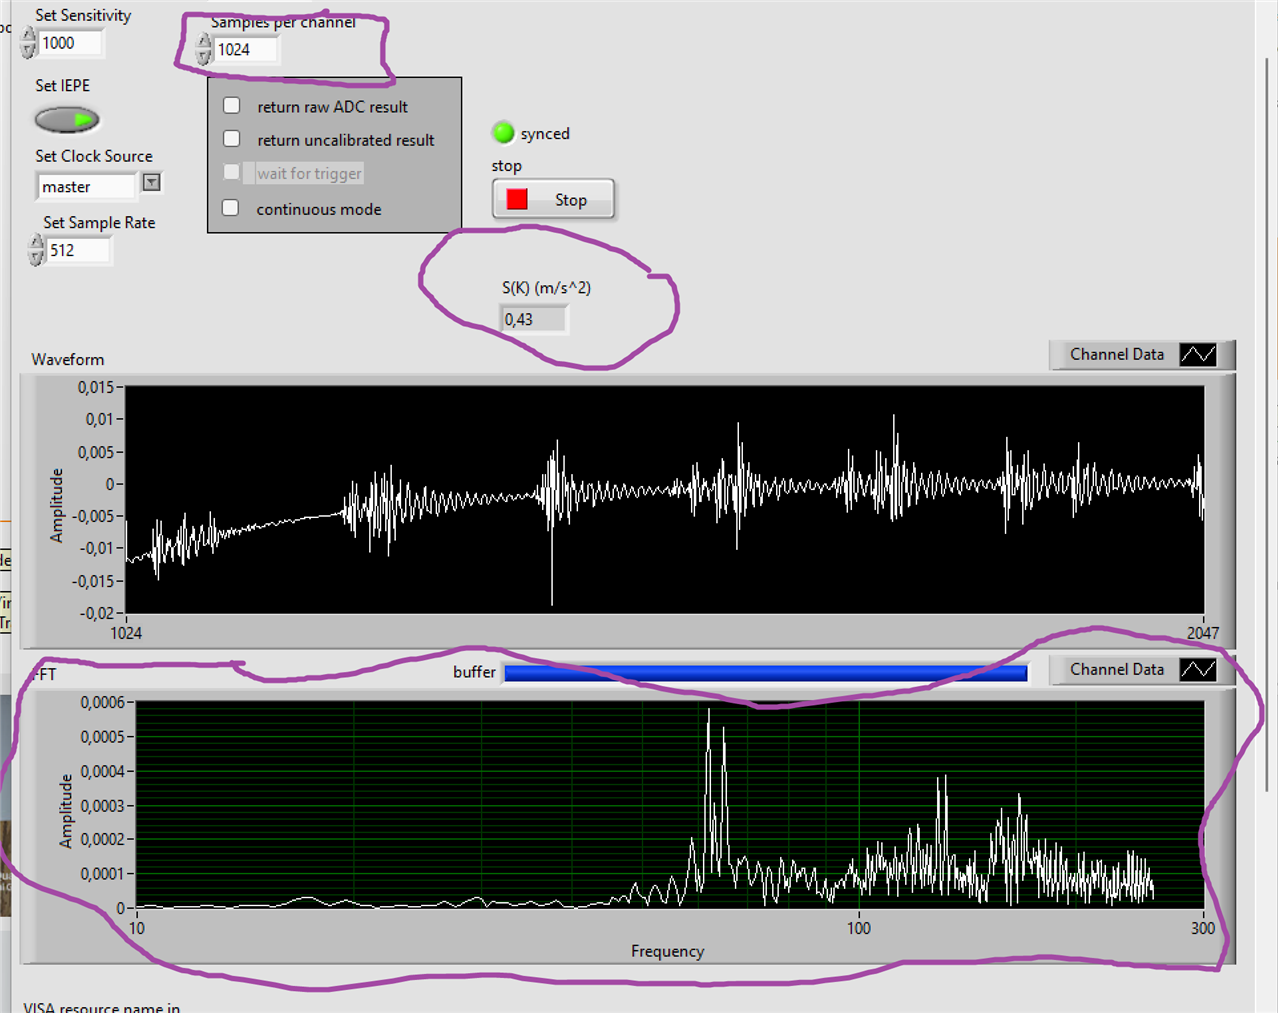
If you are running Linux with GUI, make sure to also check out the data logger example. It runs sampling at maximum speed and shows waveform and FFT in real time.
That’s it for the review. The remaining part of this report documents my experience with the device and software. I’ll first describe the custom server software and LabVIEW driver I made. Then I’ll go over the test jig and test automation flows.
The software component of this road test is the one I was serious about all the time. It had to be functional, industrial grade, maintainable. I chose for a set of Linux deamons on the Pi side, to control the DAQ HAT and provide SCPI functionality. On the LabVIEW side, I created a Virtual Instrument style driver. These were my objectives:
remotely accessible Instrument service
remotely accessible SCPI wrapper service
runs as daemon service on the Pi
LabVIEW driver with example
support for all configuration parameters except trigger
support for finite and/or continuous data logging from LabVIEW or other remote application
LabVIEW blocks in right abstraction level
On the Pi, this resulted into two services. A low level instrument service that turns the MCC library into a network callable API. It can set and get parameters, and efficiently stream the data buffers over the network. Then a SCPI service that delivers an industry standard API to the instrument. You can use the DAQ HAT in a LabVIEW flow just like you’d use a commercial oscilloscope or power supply.

The development of these services showed me that the MCC library granularity is well balanced. I often struggle when translating a C API into services or objects. This time I did both (the SCPI lib is C, the instrument service C++ with an API object wrapper). Instead of fighting to get the API fit into my work, I could use it as guidance for the structure of my own design.
When I did the LabVIEW development, it was a similar experience. The driver layout virtually matches the MCC library calls – and the Virtual Instrument paradigm:

I’ve made drivers for several other instruments. A DAQ is more difficult. The controlling side is familiar, but you have to deal with loads of fast data samples. You have to be able to eat and process them. In this road test, that was my biggest learning: how to deal with a fast data stream, over a network, in LabVIEW. Real time. LabVIEW has a pattern for this: the Producer / Consumer. It’s a multi-threaded design where one loop (producer, the high speed one) reads data and pushes it to a queue. This loop has to keep up with the DAQ HAT’s data stream. A second stream (consumer) can pick data of that stream and “deal with it”. You can see this as a design strategy: the queue serves your business logic the data. You can plug in any strategy that processes that data.

In my examples, I’ve tried three strategies:
show the wave form real time on screen
log the samples to a file
collect a set of samples (in my case 32K) and analyse them (I calculated RMS, AVG).
My LabVIEW driver provides an example flow, where you can plug in your own data processing strategy (maybe FFT? (edit:done). In my final Road Test design, I put an “aggregation and then RMS per frequency” strategy inside the consumer flow.
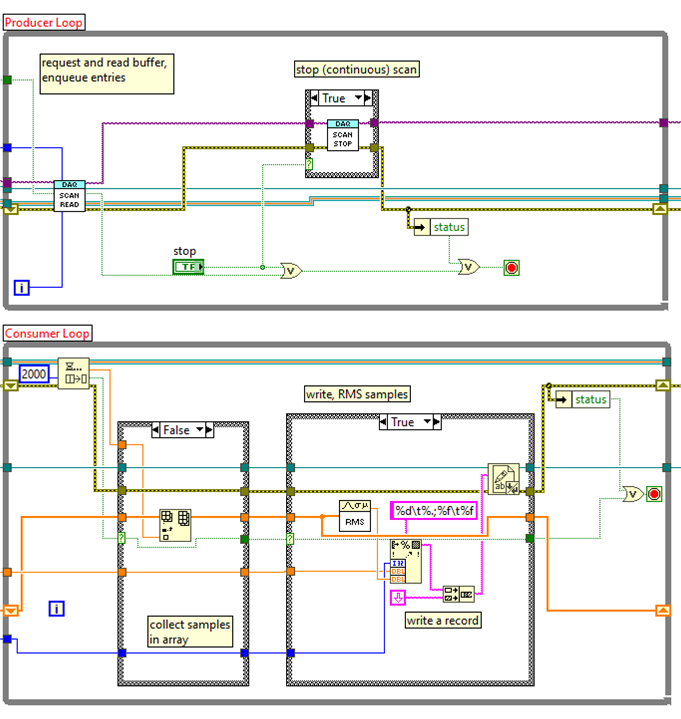
The individual posts for the road tests describe this in detail. Here are some examples:
A real-time waveform display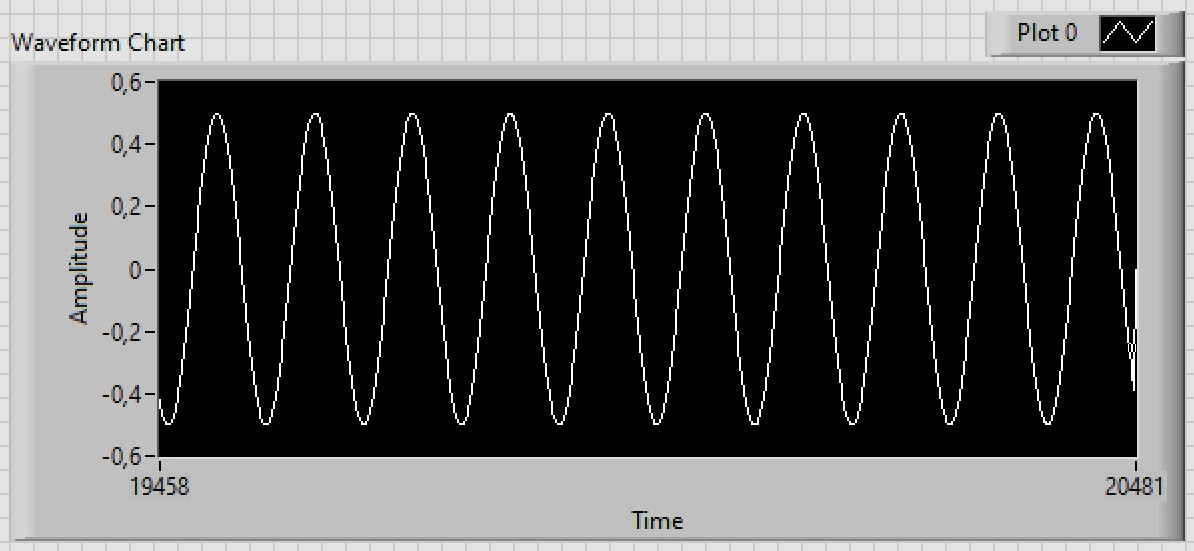
A graph of a flow that loops over a frequency range, taking 32000 samples at each frequency, then calculating and saving the RMS value to a spreadsheet.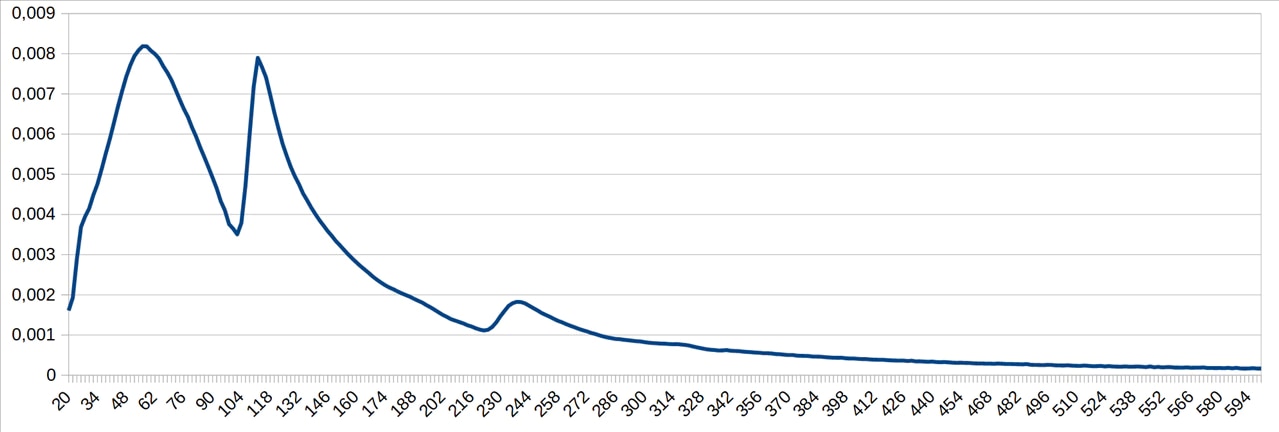
The LabVIEW driver and examples can be used in real world situations:
preventive maintenance: monitor a device and alert when its parameters get out of the normal. LabVIEW has a white paper that explains how you can use data acquired from accelerators to spot issues. My driver delivers that data, ready to be used by the algorithms in that paper.
Design validation: will my automotive control board survive in a real automobile? For how long? Where are the limits? Again, the driver and its ability to be included in a wider process, allow for this kind of analysis.
The LabVIEW and Linux Services sources are available on my GitHub.
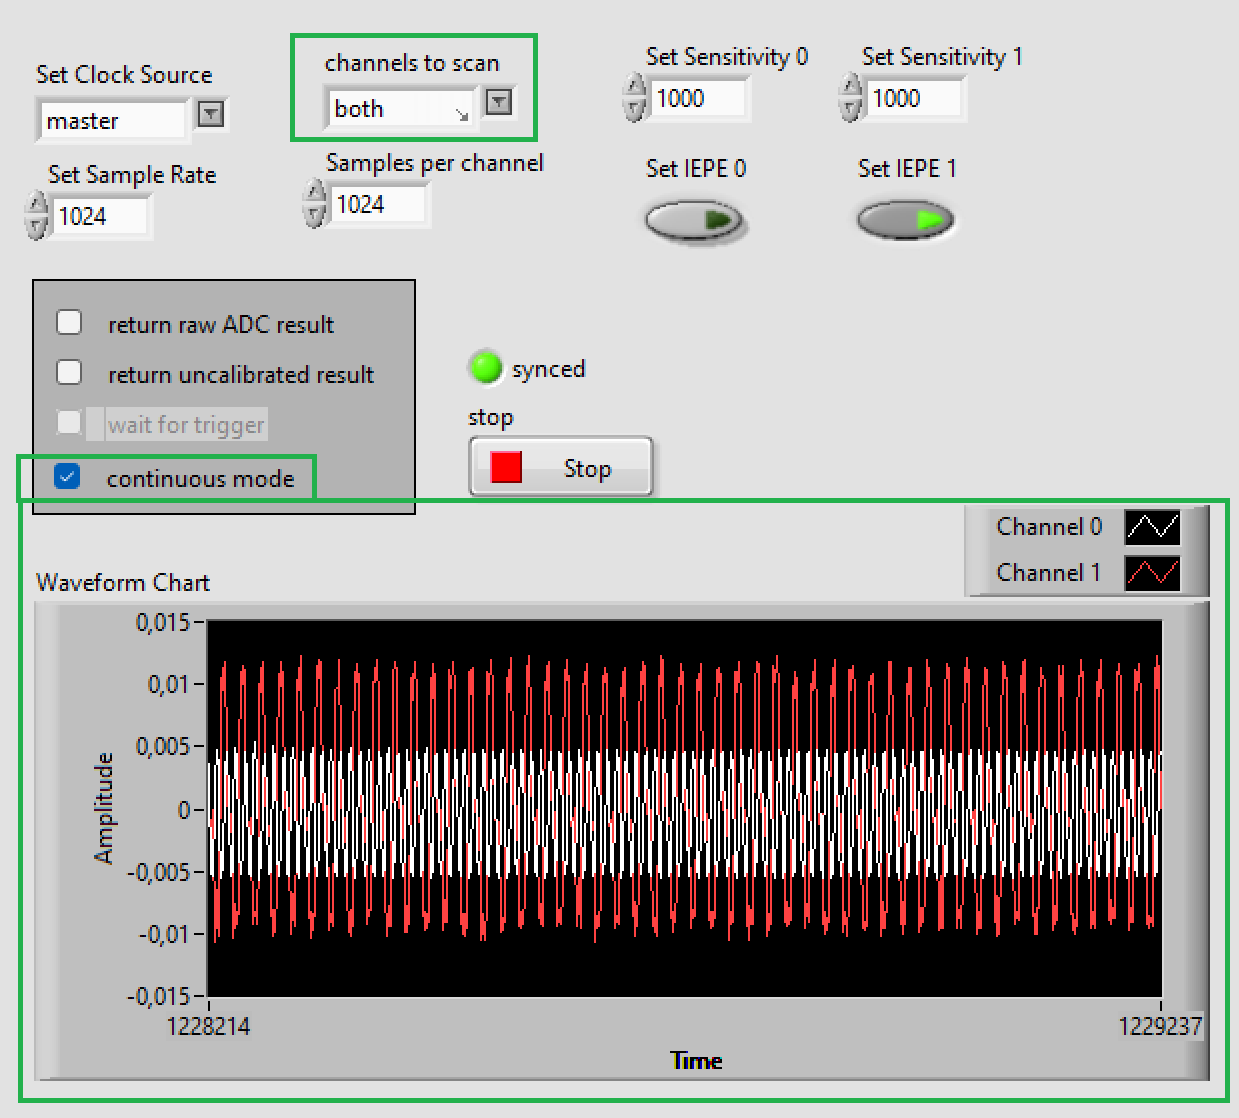
image: dual channel sampling LabVIEW driver example
It’s a prototype for a vibration platform. A shaking device you can use to analyse how a “thing” behaves under vibrations. This was obviously a side goal of my road test. A story hook to be able to show how the DAQ HAT and my software behave. The base is a subwoofer with built-in amplifier. A platform is built on top of the speaker. That platform serves as the mounting point for devices you want to specify or long-duration-test. The input for the shaker is a sinusoidal signal from a function generator. This is where two initiatives come together: I wrote the LabVIEW driver for that function generator too. This design proves that both drivers are up to the job.
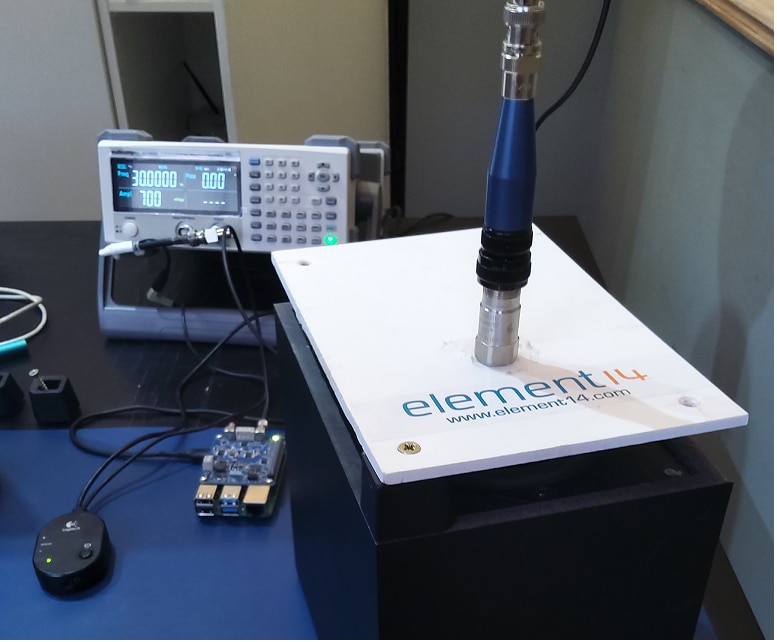
I made the jig with material I could get to. The subwoofer is part of a Logitech PC-audio 2.1 audio setup. Small, 15 Watt – but good enough for this pilot. The adaption to a vibration test jig was done by balearicdynamics at the Ingegno maker space in Drongen. The usable range for this jig is from 30 to 90Hz. Below that, the subwoofer’s audio filter cuts off the signal. Above 90 Hz, the device is difficult to control. Resonance over-tunes useful data. But the end result is impressive. This is a real useful range to learn about vibration and analysing its data. And you can learn how to compensate for non-linearities.

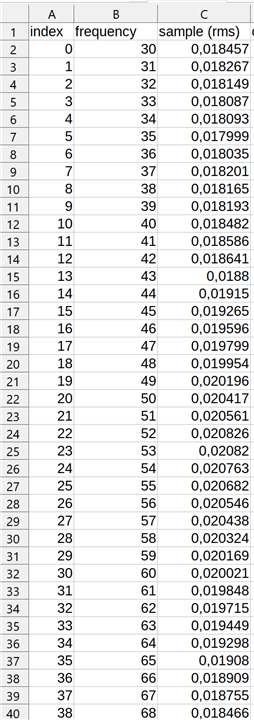
I made a LabVIEW flow to automate the vibration test jig. It controls a frequency generator and the DAQ HAT. You tell it to sweep over a range of frequencies. The function generator lets the test jig shake at a given amplitude. At each stop, the DAQ takes 32,000 samples, then calculates the RMS value of that set. It writes the results to a spreadsheet and continues. Until the whole range is covered.
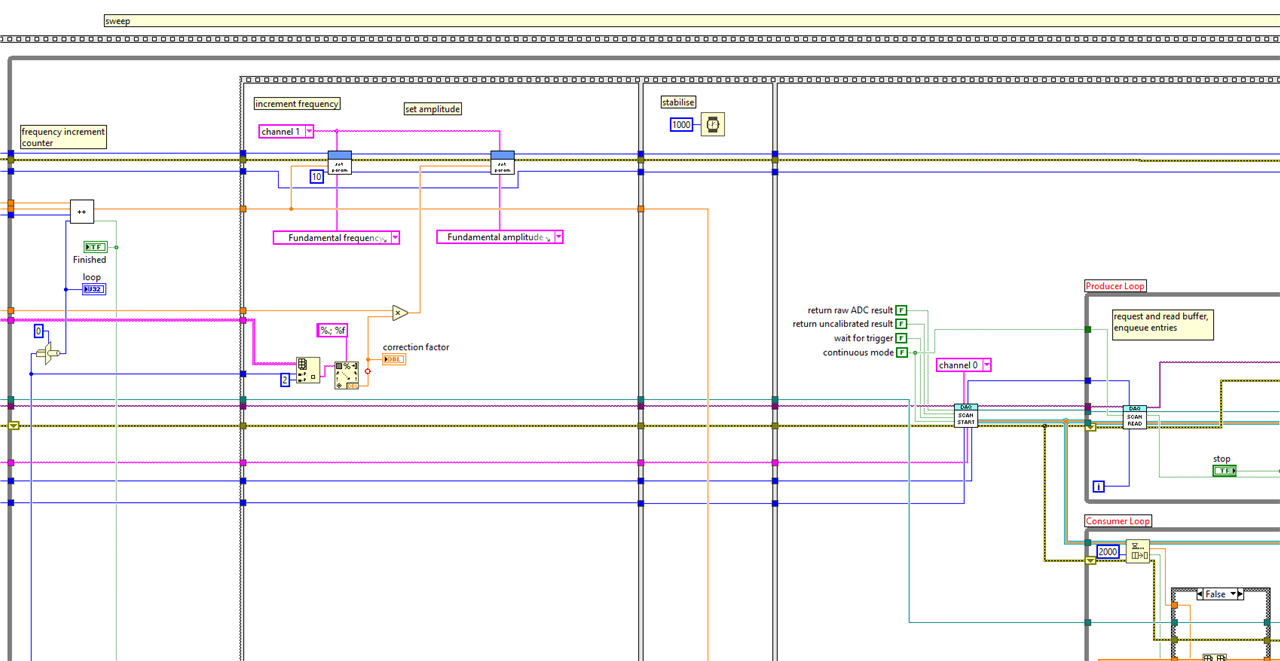
I’ve made two flavours. A simple one that sweeps and collects the output. A second one that compensates for the non-linearity of the test jig – a simple coherence corrector.
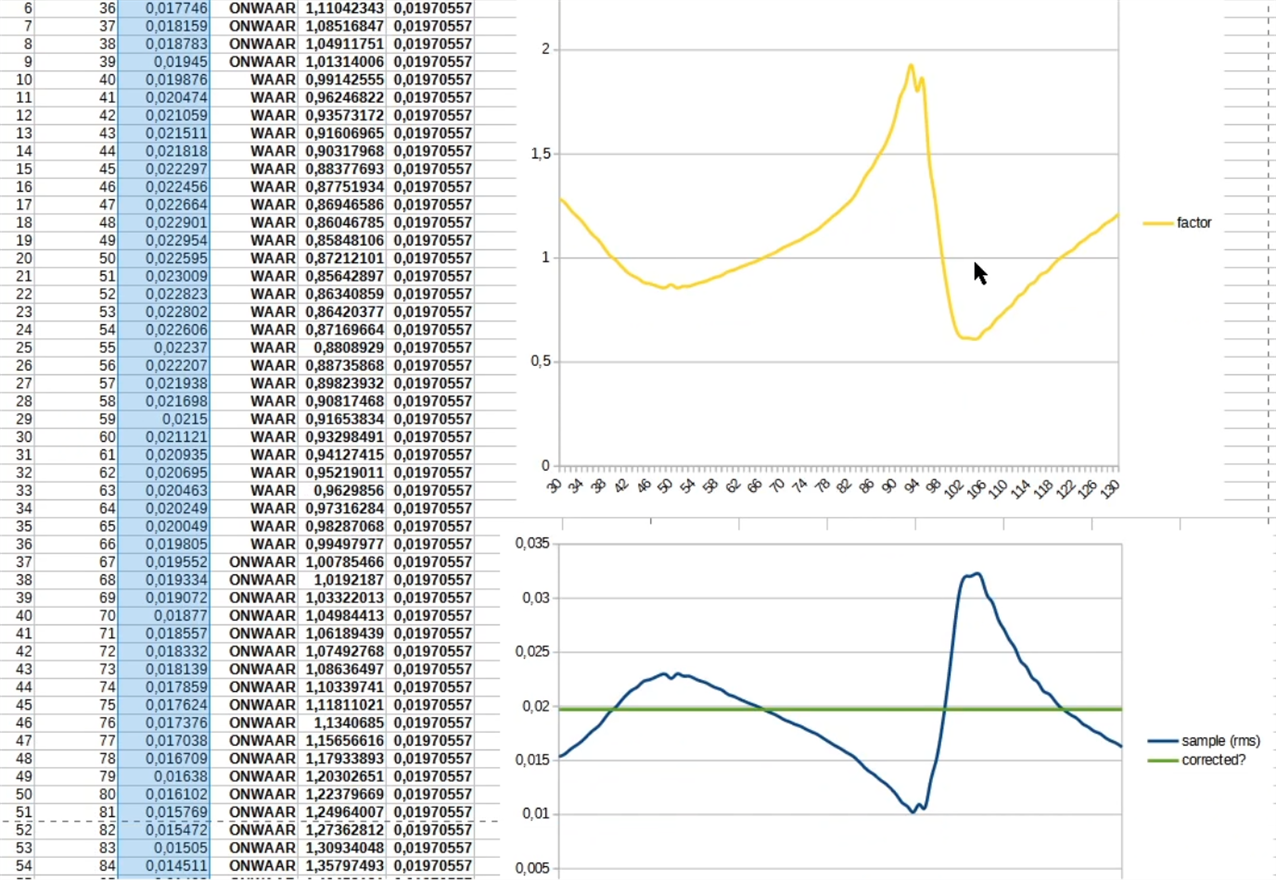
The coherence flow uses the output of a simple flow as its correction guideline. You first run a sweep on the empty table, collect the jig’s behaviour, and feed that in to the next run with the test device mounted. The test flow will try to compensate for the base jig’s non-linearities (physically force the jig to be linear) while testing your gizmo. As indicate before, I managed to achieve this in the 30 – 90 Hz range.
If you are looking for measurements that show accuracy of the DAQ HAT, I’m going to point you to Shabaz’ road test. He validated the behaviour related to specs – next to measurements on several devices. In my road test and accompanying blogs, you’ll find measurements related to the test device I’ve built. It’s showing the DAQ HAT and sensor in use. I did verify if data was within specs along the way. Both the sensor and HAT complied with their own specs. The DAQ, and the Pi that controls it, can keep up with the maximum data rates. I’ve run this setup for hours, collecting millions of samples. It was an exercise to prove that my software was reliable, but in parallel it showed that the road test kit didn’t miss a beat.
Both DAQ HAT and sensor are able to detect movements that I could barely feel, and single step changes in those movements. The analog front end performs very good. The ADC modules and software keep up just fine. When running in maximum speed and rate continuous sampling mode -with my service software streaming data over the network – the load on the Pi 4 was at 22% of CPU. Memory requirements can be easily calculated. The software needs virtually no memory. Buffer requires a long double (4 bytes) per sample per channel. That’s about it.
I love these unusual element14 road tests. Devices that you don’t typically own or have experience with. They give you the most opportunities to learn new things. This one allowed me to learn niche skills: how to measure vibration. How to analyse the data and derive decisions from it. How to deal with a DAQ. How to build a LabVIEW driver for a DAQ. I learned about IEPE acceleration sensors and their use.

I also think that this is a road test that gives. shabaz and I got a kit and C / Python software. We both turned it into a design that can be used in academic and industrial settings. You’ve read about my LabVIEW driver here. Shabaz designed the integration with MatLab. The user community has a new set of choices.
Thank you for following along.

